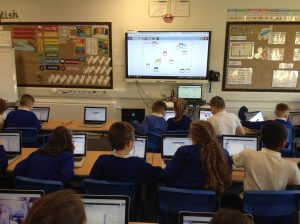
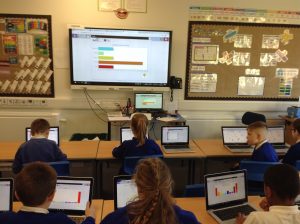
Today in Computing we’ve been discussing how much time we actually spend using screens, during a typical week – that includes watching television! We created a collaborative database and watched Mrs Grindrod’s whiteboard as all the results from each class member started to be collated. We were really surprised at how much time we spend looking a screen and have decided that we need to get out and play in the fresh air a lot more! We used the results to create some bar graphs and pie charts.

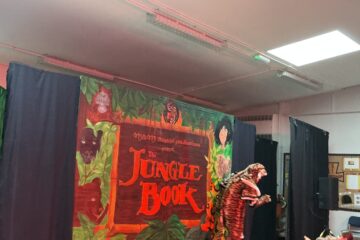
The Jungle Book
KS2 were treated to a fantastic performance of The Jungle Book by M&M theatre company. All of the children really enjoyed the show and Year 6 were able to take part in a workshop afterwards. Read more


6 Comments
Alex · 21st November 2019 at 3:34 pm
I loved this lesson. Very fun
Alex · 21st November 2019 at 3:32 pm
I loved this lesson…even though I think I spend to much time on screens
islamae · 19th November 2019 at 4:16 pm
I learnt a lot in this lesson
Rhianne Mutch · 18th November 2019 at 9:41 pm
This was really fun I loved it
islamae · 18th November 2019 at 4:45 pm
This was good to know I learned not to spend too long on screens.
Loganc · 18th November 2019 at 3:34 pm
I only have 100mins on a electrical and it was fun today doing this