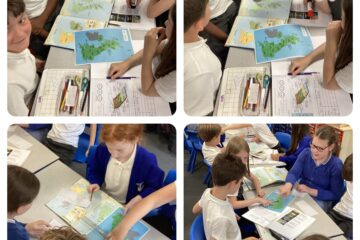
Year 6 had taken part in a traffic survey on Queen’s Park Road, tallying the amount, colour and types of vehicles travelling to and from Heywood.
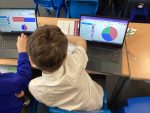
To be able to understand the data better, we created a range of graphs to display our results visually, as a Geographer would do when conducting fieldwork. We used our computing skills and Purple Mash to create our graphs.

0 Comments