Computing
Year 3 Birch Computing & Spreadsheets
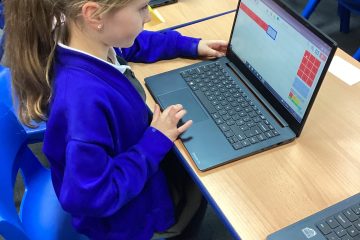
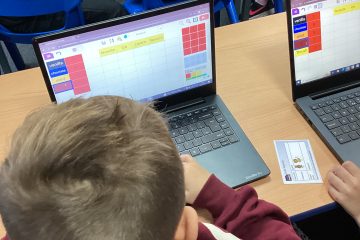
We used Purple Mash Spreadsheets to input data and then use the tools to make our data show us which numbers are more than, less than or equal to one another.
Christian Values
Year 3 Birch Christingle Fun!
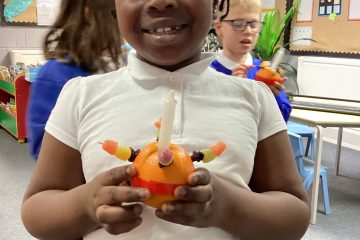
We loved learning about Christingle and the services we have at this time of year. We made Christingles to take home using oranges, fruits, sweets, red ribbon and a candle. We enjoyed learning about what each part of the Christingle represents.
After school club
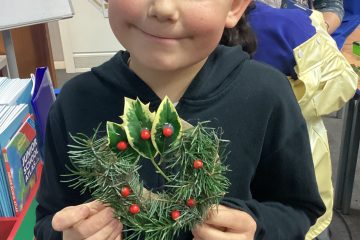
Gardening Club – Wreath Making
Children loved foraging for their materials to create their wreaths. They loved designing how they will lay it out and how many berries they want to put on. Well done everyone!
Art & Design
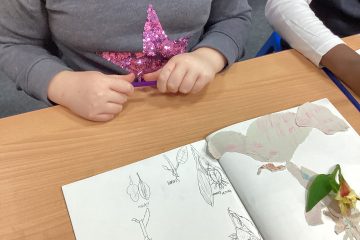
Year 3 Birch – observational drawings
We loved looking at our beautiful flowers today and recreating the shapes from the petals and stems. There were some wonderful drawings and the children took their time to create these.
Learning for Life
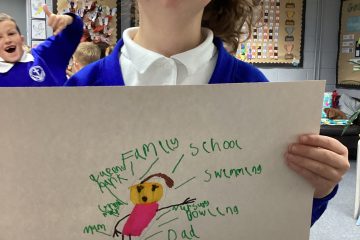
Year 3 – Communities
We talked about communities and what this meant. We discovered that we are all involved with a few communities so we decided to write down which communities we were involved in! There’s lots of variety from our school community to Thai Boxing!
Anti- Bullying Ambassadors
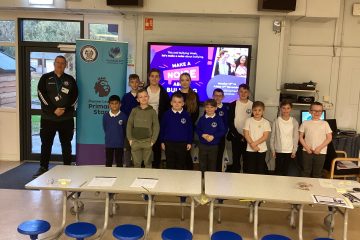
Anti-bullying Week
The anti-bullying council had a lovely opportunity today to work with RAFC Community. This is a charity that works with schools to promote positive messages. This week, the focus was anti-bullying. They learnt what bullying was and did lots of active activities surrounding this topic. The children loved it and Read more…
Art & Design
Year 3 Birch – looking for textures in art
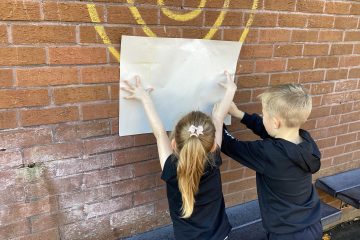
Year 3 have had such a fun afternoon looking for different textures to create rubbings from. We looked indoors and outdoors to find contrasting textures to use in our art work. We then came in and created a picture with the rubbings by tearing shapes out of them. They looked Read more…
Computing
Year 3 Birch Computing – spreadsheets
We loved computing today. We used spreadsheets to input data and then used this to create a graph. We used our favourite ice cream flavours.
