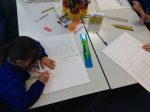
As part of our ID topic, we have been collecting data about our class.
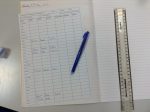
We have taken significant measurements of each member of the class and recorded them on a table.
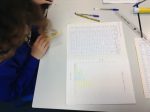
From there, we have begun to present the data effectively on a range of graphs and charts. This has allowed us to see clearly what the average Year 6 pupil would probably look like.
Over the next two weeks, we will be looking at measurements, characteristics, likes and dislikes and even fingerprints, to try and build the average Year 6 child to represent our class.


0 Comments