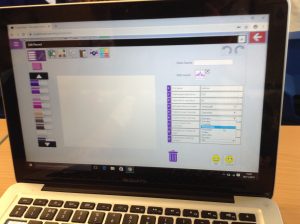
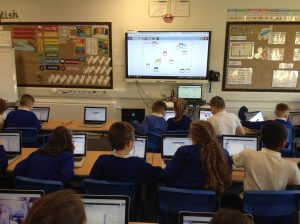
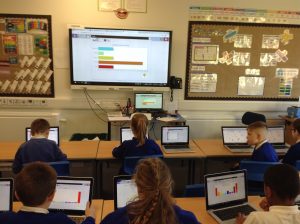
Today in Computing we’ve been discussing how much time we actually spend using screens, during a typical week – that includes watching television! We created a collaborative database and watched Mrs Grindrod’s whiteboard as all the results from each class member started to be collated. We were really surprised at how much time we spend looking a screen and have decided that we need to get out and play in the fresh air a lot more! We used the results to create some bar graphs and pie charts.
Physical Education
Super Swimmers!
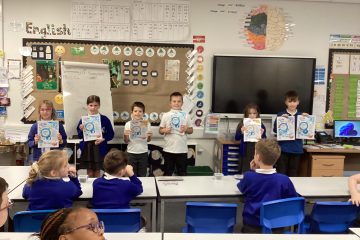
Year 4 Maple currently go to Heywood Sports Village every Monday afternoon for their swimming lesson. They are all doing really well and making lots of progress. Here are some of them with their most Read more…

6 Comments
Alex · 21st November 2019 at 3:34 pm
I loved this lesson. Very fun
Alex · 21st November 2019 at 3:32 pm
I loved this lesson…even though I think I spend to much time on screens
islamae · 19th November 2019 at 4:16 pm
I learnt a lot in this lesson
Rhianne Mutch · 18th November 2019 at 9:41 pm
This was really fun I loved it
islamae · 18th November 2019 at 4:45 pm
This was good to know I learned not to spend too long on screens.
Loganc · 18th November 2019 at 3:34 pm
I only have 100mins on a electrical and it was fun today doing this