Weather reporters

In geography, we have been learning about weather. This week, we watched weather reports and discussed why they are important. We also learnt symbols that are used to show different types of weather. Then, we became the reporters. We used language such as North, South, inland and coastal to act Read more…

River study

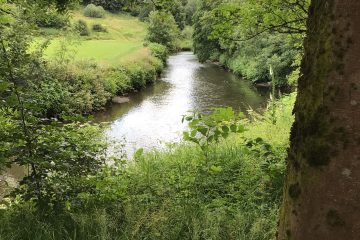
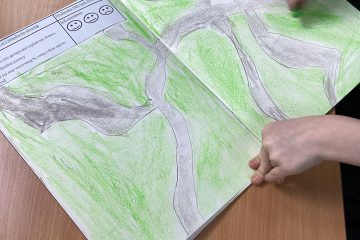
During Geography lessons, Year 4 are learning about Rivers so we took a trip to see the River Roch. Whilst were we there, we conducted an investigation to look at the speed of the River. We also enjoyed some quiet time sketching the river. 

Beach day!

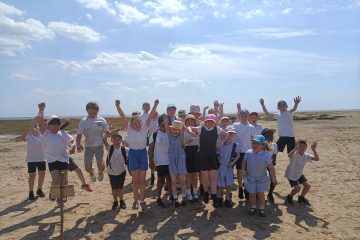
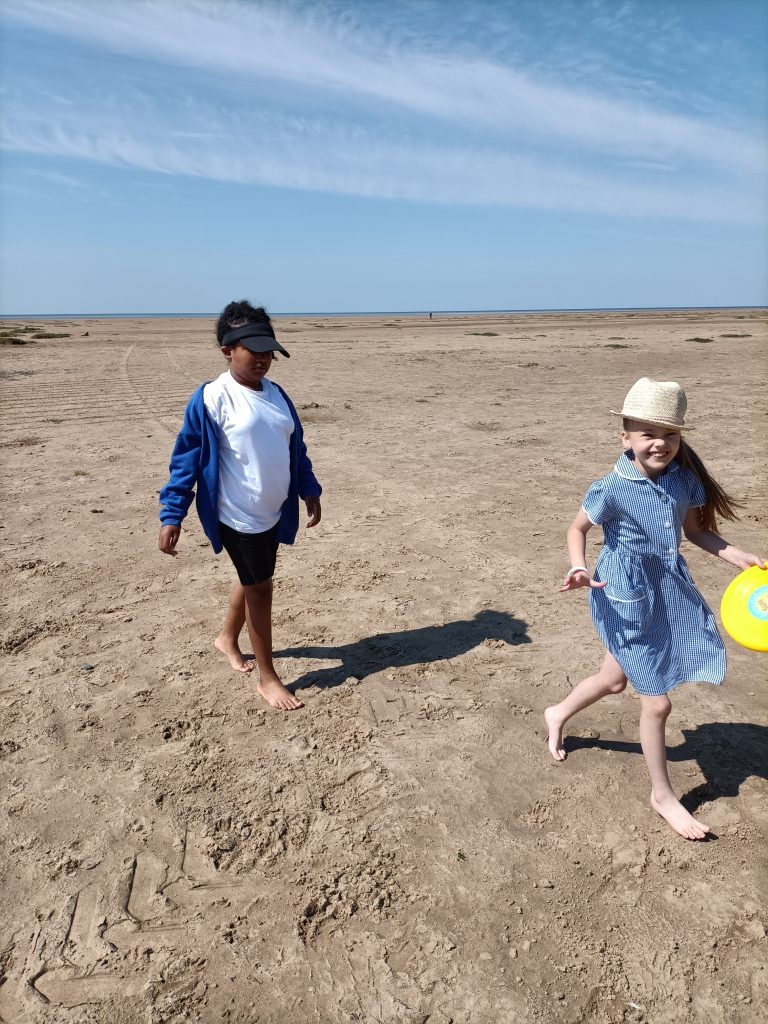
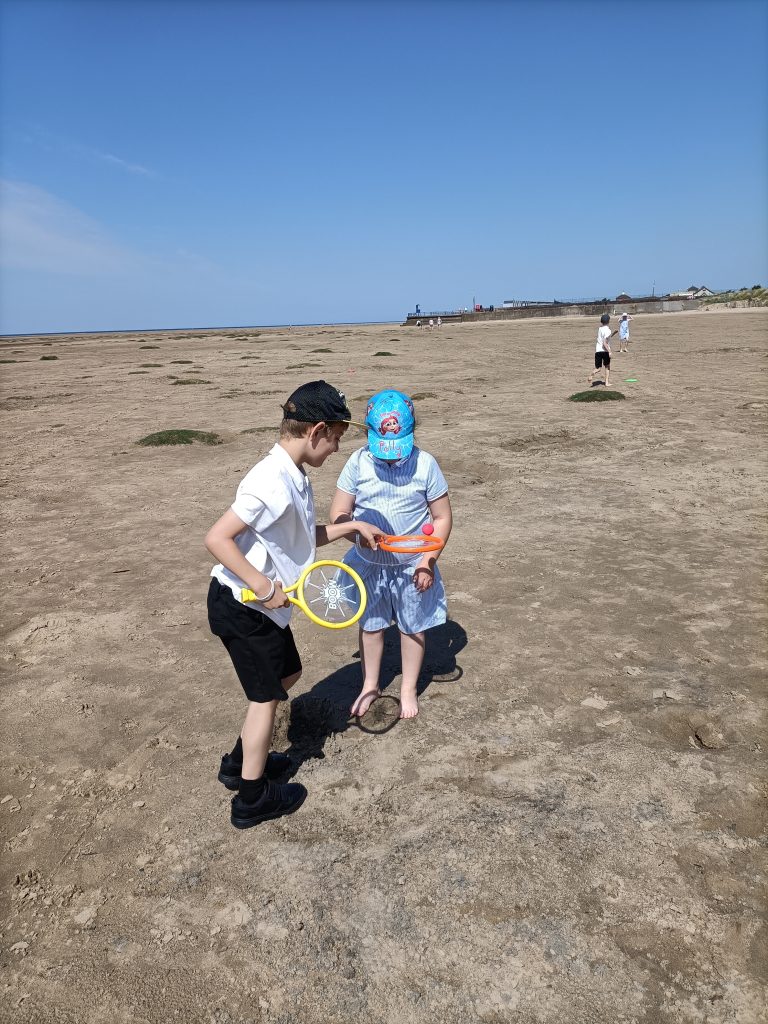
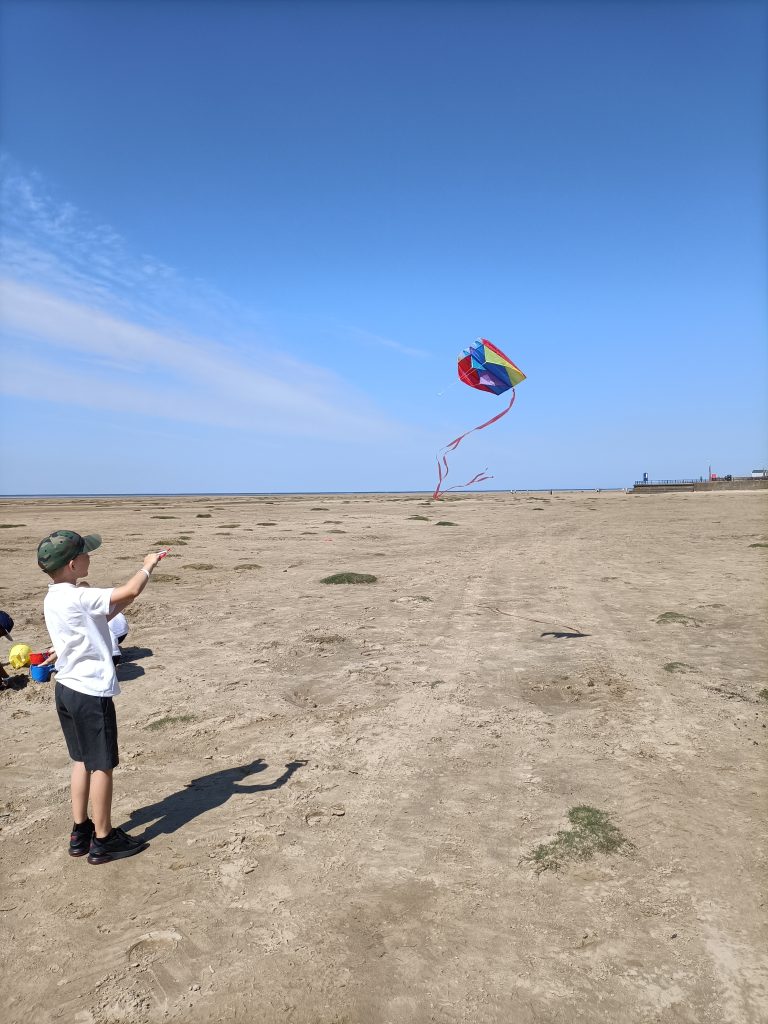
Year 5 had a great day at St Annes beach today. It was glorious weather and the children had lots of fun in the sunshine. The Lancashire Wildlife Trust set up camp for us and carried out some fantastic beach school workshops learning about the wildlife that live in the coastal habitat and how to protect them. The children explored the sand dunes using nets and found lots of minibeasts were living there. We also explored the strandline searching for signs of life such as egg cases and shells. We also carried out some practical activities to learn about the tides and why there is so much life on the beach. The children decided that they didn’t like the litter on the beach and carried out their own litter pick to clean the beach up. There was also some time to play on the beach. Everyone enjoyed building sandcastles, flying kites and frisbees. There was some fantastic teamwork going on.

(more…)

Water cycle models

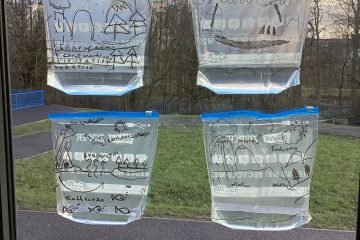
During English lessons, we are writing our own guided tours all about water. Today we looked at the water cycle and created our own models. We included key words such as – evaporation, condensation, precipitation and collection. We have placed our water cycles on the window and will be looking Read more…

Analysing Fieldwork Data

Year 6 had taken part in a traffic survey on Queen’s Park Road, tallying the amount, colour and types of vehicles travelling to and from Heywood.   To be able to understand the data better, we created a range of graphs to display our results visually, as a Geographer would Read more…